Home > Publications > Policy Briefs > 10/ Appraising local food precarity
– Food precarity appraisal requires information on five indicator categories.
– Available statistics only partially shed light on the food precarity concept.
– Linking socioeconomic precarity with the foodscape may highlight food access inequalities.
Food is still mainly perceived in terms of its biological and nutritional functions, concealing the fact that it is a major source of inequality. The food precarity problem is thus mainly tackled by boosting food distribution to so-called poor populations (food aid). Yet many other avenues need to be explored. How can the food precarity of different populations be characterised? How can the requests of concerned individuals be taken into account? What are the levers for action? The research outlined in this policy brief strives to answer all or part of these questions.
The European Union defines poverty on the basis of a relative monetary approach, i.e. in relation to a threshold set according to income distributions per country. In France, this framework is used by the National Institute of Statistics and Economic Studies (INSEE) and all other institutions concerned by poverty statistics (National Family Allowance Fund, local authorities, etc.). These statistics are supplemented by a ’living standards’ approach whereby, in particular, material deprivation is taken into account. Combining these two sources of information yields a poverty profile that offers very little information on the food issue.
Food insecurity is defined as a counterpoint to food security, i.e. it is considered to prevail when food security criteria are not fulfilled (Paturel, 2017). This notion of food insecurity is common in the Global South and English-speaking countries, while also being applied by healthcare professionals in France. Public health programmes highlight the functional nutritional and biological aspects of food, whereas food insecurity is linked with economic poverty and the decline in the nutritional quality of widely consumed industrial foods.
The notion of food precarity stems from research currents focused on the nutrition of poor, precarious, vulnerable or otherwise disadvantaged people. This precarity concept emerged on the French scene via:
– the essay of Paugam (1991), where he stresses that social inclusion hinges on the presence or absence of social ties.
– a definition put forward by the French Economic and Social Council, stemming from the work of Joseph Wresinski (1987) and geared towards combating poverty, which led to legislation that set a basic guaranteed income (RMI) in 1988: “Precarity is the absence of one or more securities, particularly employment security, enabling individuals and families to fulfil their professional, family and social obligations and exercise their fundamental rights. The resulting insecurity may be relatively widespread and have more or less serious and lasting impacts. […]” The precarity classification is applied in different fields on the basis of this definition, combined with a social qualifier: economic precarity, energy precarity, food precarity, etc.
However, the French food model developed by Fischler and Masson (2008) qualifies precarity in its food dimension and could help us understand why precarity is the real issue, not poverty. Indeed, all social programmes that deal with food precarity implicitly refer to this model, i.e. for French people, eating and cooking together are more important than the quality of food products and their nutritional impacts. Hence, eating alone implies severing ties with others, and it means even more exclusion for people in a social precarity situation. Food must be viewed through a systems-based approach not solely focused on its biological function. Social, cultural and hedonistic functions are equally important in addressing food precarity.
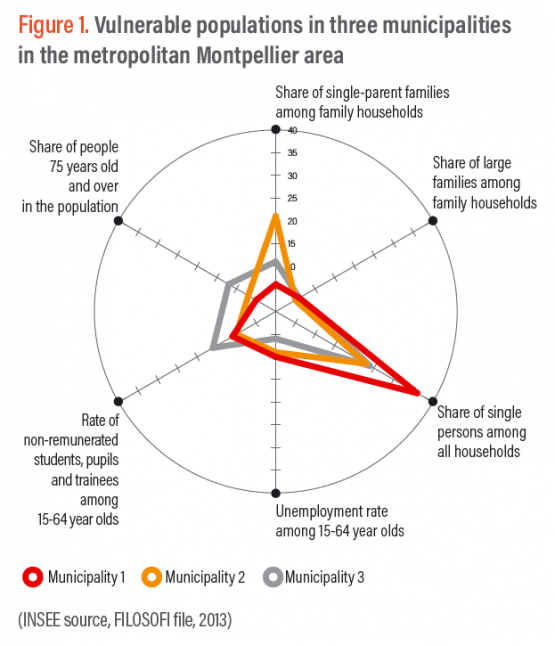
When characterizing the economic precarity of a local community, it is useful to distinguish between the monetary precarity of households that affects their ability to access food, and the more vulnerable household categories. Regarding monetary precarity, French databases that can be accessed at the national level are managed by INSEE (municipal demographic files) and FiloSoFi (taxable households), and by the Occitanie social monitoring platform at the regional level (household social benefits, minimum social benefits). Data on the vulnerability of populations concern the socioeconomic precarity of certain individuals or families (single parents, large families, single people, unemployed people, etc.), as well as the specific nutritional needs or functional limitations of some individuals (pensioners, people over 75 years of age, young children, minors, students).
Economic precarity appraisals may reflect these features in a comparative graph of territorial profiles. Figure 1 shows that the vulnerability profiles of populations in the studied municipalities vary due to the presence of single-parent families, people living alone and students. This profile is specific to the metropolitan Montpellier area. Such municipality profiles may vary markedly among urban or rural areas.
Another aspect of socioeconomic precarity is the relationship between food and health which, as many studies have shown, are closely linked. Nevertheless, from both medical and nutritional standpoints, these studies showed that diseases that appeared to be directly related to eating habits, such as obesity or diabetes, are actually due to a diverse range of factors. The 2012 ObÉpi French national obesity epidemiological survey revealed a decline in obesity among the upper and middle classes from 2007 onwards, whereas this trend barely applied to vulnerable populations. However, the prevalence of obesity among children has not increased since 2002 across all population groups. But a study on the corpulence of 4-5 year old children attending school in Hérault department (Ledesert et Boulahtouf, 2012) highlighted spatial inequalities regarding health—the areas covered by the Montpellier departmental solidarity agencies (corresponding to priority urban policy districts) were found to be where there was the highest rate of obesity and overweight people among the 16 departmental agencies for which data were available.
While research on social inequalities related to food is currently being conducted to gain insight into food behaviours, few cross-sectional studies have been conducted that could—by combining epidemiological and social approaches—potentially generate guidelines for action. These observations should also be gathered from a more diverse range of neighbourhoods and municipalities than was the case in current surveys.
Another precarity analysis perspective is geared towards understanding the food access potential of vulnerable communities. The aim is to characterize the existing food supply, its accessibility and societal, advertising and political incentives. We define the foodscape as a set of places, equipment and services that enable people in a given area to have ready access to food products. This space ‘to be seen’ by consumers is also one that is ‘experienced and perceived’ differently by consumers. A methodological approach to assess food precarity from the perspective of three foodscape components is outlined below.
School catering – a key issue with a complex verdict
The management of kindergarten and elementary school canteens is a key lever for reducing food precarity, as it is fully recognised that food insufficiency during school hours accentuates children’s learning difficulties. State-of-the-art research has helped identify two main levers to reduce this food insufficiency: adapting the meal price to the monetary capacities of households sending children to school, and distributing breakfasts to all children at school. A study of pricing systems for school canteens in 23 municipalities in the metropolitan Montpellier area revealed a current trend towards differentiating meal prices according to household income, subsidies and family expenses. However, the pricing systems are too varied to make a comparison and develop indicators. Moreover, the municipalities do not have socioeconomic data at hand to assess the difficulties of canteen access facing children from vulnerable families, the relevance of their pricing policy, and the effectiveness of specific assistance from the Municipal Social Action Centre or the Departmental Council. In addition to this lack of information, there is scant knowledge on the cost related to the nutritional quality of meals, which in turn is linked to canteen management methods. The problem is complex, but indicators are available that actors could take into account. For example, it might be relevant to compare disaggregated data from INSEE and the Family Allowance Fund on the share of children from vulnerable families in the total number of children benefiting from reduced canteen rates.
Interlinking food supply and the household mobility capacity
Some populations may limit the choice of food supply locations due to a lack of means of transport. Assessments are based on spatial studies on the commercial food supply with the aim of identifying areas without food outlets or with inadequate public transport connections. Food outlets can be identified from various data sources: the business registry, INSEE statistical databases and control organization databases (fire safety, veterinary services, etc.). Two main data sources have been identified regarding household mobility capacities: public transport networks and the INSEE population census, which provides information on the share of non-motorized households at the ‘aggregated units for statistical information’ (IRIS) [1] or municipality scale.
Food aid overview
Food aid is one response to food precarity. The present system is being reorganized and the process of empowering associations is transforming the distribution methods (see SoWhat 9). In the absence of source data, a global approach to the food practices of beneficiaries and networks of local actors is essential to map out this entire segment of the foodscape.
Studies on food precarity across the foodscape have highlighted major shortcomings in terms of the availability of quality data. When viewed through this lens, it is possible to overcome the monetary limitations by taking the relationships that populations have with the food supply in specific areas into account.
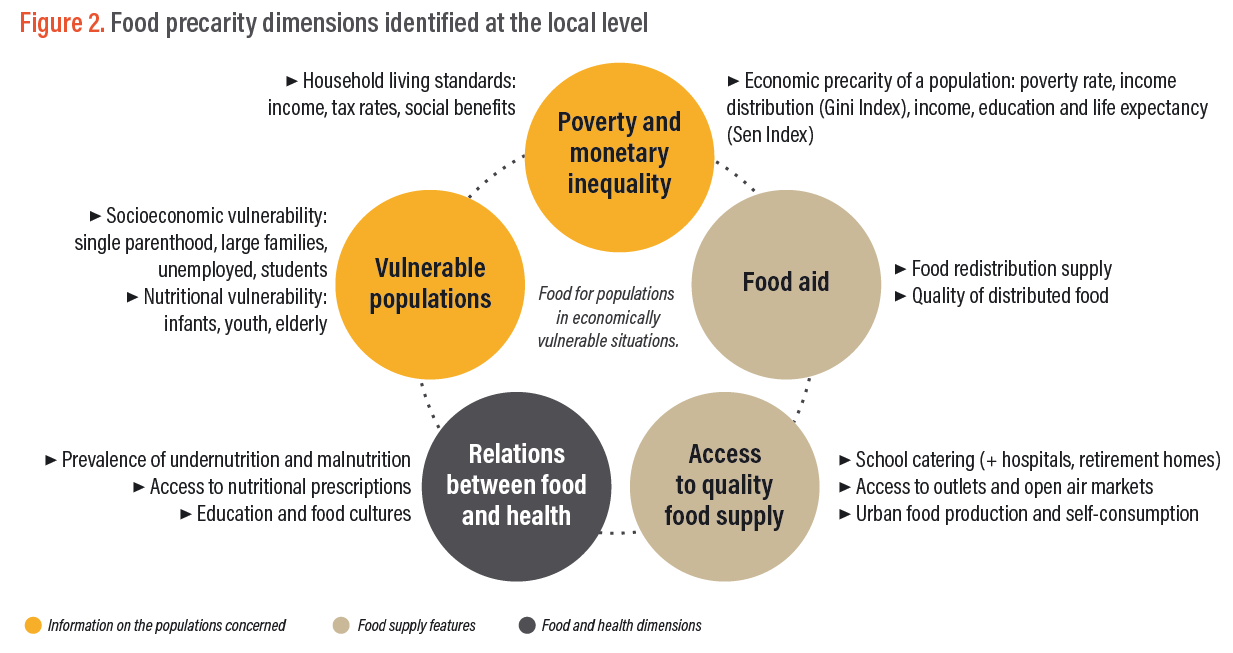
This policy brief provides the foundations for building a place-based assessment strategy. In line with an urban food system approach, we have identified five indicator categories for which information could be gathered for the purpose of developing or assessing a public policy. Two of them focus on the populations concerned, two others concern the food supply features, while the fifth one combines the food and health dimensions. Figure 2 lists the indicator categories to be used in the appraisal.
This methodological research carried out in the metropolitan Montpellier area was based on three types of analysis: a review of the scientific literature and local documentation; an analysis of open databases or databases developed for specific service needs; and interviews of technicians and elected officials from local and government departments.
The databases studied—accessed between 2011 and 2013—consisted of raw, aggregated or spatial statistical data. Their potential use for assessing local food precarity was analysed by comparing their content with current published scientific data. They were tested via statistical and spatial analyses.
Interviews were conducted in June 2015 with three aims: 1/ to identify and gather new data and develop databases; 2/ to identify gaps in terms of food precarity monitoring indicators; and 3/ to characterize some mechanisms and tools to combat food precarity.
Dominique Paturel, Christophe-Toussaint Soulard and Simon Vonthron INRAE, UMR Innovation, Montpellier, France
Fischler, C., Masson, E. (2008) Manger. Français, Européens et Américains face à l’alimentation. Paris, Éditions Odile Jacob.
Ledésert, B., Boulahtouf, H. (2012) Rapport « Corpulence, habitudes alimentaires à l’école et activité physique chez les enfants de 4-5 ans scolarisés dans l’Hérault ». Creai-Orsl et Conseil Général de l’Hérault, Montpellier, 33 p., [online] http://bdsp-ehesp.inist.fr/vibad/index.php?action=getRecordDetail&idt=468347
Paturel, D. (2017) Insécurité alimentaire et précarité alimentaire : note pour l’Atelier 12, EGA, [online] https://inra.academia.edu/DominiquePATUREL
Paugam, S. (1991) La disqualification sociale. Essai sur la nouvelle pauvreté. Paris, PUF.
Wresinski, J. (1987). Rapport « Grande pauvreté et précarité économique et sociale ». Conseil économique et social français, Paris, Journal Officiel de la République Française, 113 p., [online]
https://www.lecese.fr/sites/default/files/pdf/Rapports/1987/Rapport-WRESINSKI.pdf
This policy brief takes inspiration from the following PhD thesis dissertation:
Vonthron S. Offre commerciale alimentaire et pratiques spatiales d’approvisionnement des ménages : une géographie des paysages alimentaires urbains. Doctoral thesis, Université Paul Valéry, Montpellier SupAgro, Montpellier [in progress].
[1] Baseline unit used by INSEE for the dissemination of infra-municipal spatial data.